State-based sales territories underperform because they assume all states are roughly equal markets, which they never are. Mapping your existing customers reveals the real density clusters and lookalike adjacencies, which produces fairer rep assignments, better quota balance, and faster ramp times. The 4-step workflow takes about 15 minutes if your CRM data is connected to a map tool.
You design sales territories with CRM map data by plotting existing customers, drawing territory boundaries around the natural density clusters, balancing the territories on revenue or account count, and assigning reps to the territories that match their experience. State-based territories miss the actual customer geography and produce uneven workloads from day one.
You're hiring a regional rep for the Southeast. You have 2,800 customers across HubSpot. The state-level CRM filter says "we have customers in Georgia, North Carolina, Florida, and Tennessee." That's true. It's also useless for designing the rep's territory because it doesn't tell you whether your customers are in Atlanta or Macon, in Charlotte or Asheville, in Nashville or Memphis. Those are different sales motions.
What is sales territory planning?
Sales territory planning is the process of dividing accounts and prospects into coverage zones, then assigning reps to each zone based on their experience and capacity. Done well, territories balance workload across reps, reduce travel time, and match rep skill to local market characteristics. Done with state-level CRM data alone, territories end up unbalanced because states aren't markets and rep capacity doesn't match arbitrary state boundaries.
Geographic territory planning is one of several territory models. Other approaches include vertical (by industry), named-account (by company), or revenue-band (by deal size). Most B2B sales teams use a hybrid where geography is one input alongside vertical or segment fit.
Why state-based territories underperform
State boundaries are political artifacts, not customer geography. Three problems with using them as territory lines:
- Within-state variation. California is 800 miles long. A rep covering "California" handles San Diego startups and Sacramento mid-market in the same territory. Different buyers, different sales motions, different drive times.
- Cross-state metros. New York City spans NJ, NY, and CT. Kansas City spans Kansas and Missouri. State-line territories split natural markets and double-cover them with two reps.
- Density mismatch. Texas has roughly the same square mileage as France. Rhode Island fits inside a single Texas county. State-based territories give a rep 5 customers in Wyoming or 500 in Texas with no mechanism to balance the difference.
Marketing and sales ops teams default to state-level territories anyway because the only granular geographic filter most CRMs offer is state, ZIP, or city. None of those map cleanly to the way customers actually cluster.
The map-based approach to territory design
The workflow:
1. Plot all existing customers and active prospects on a map
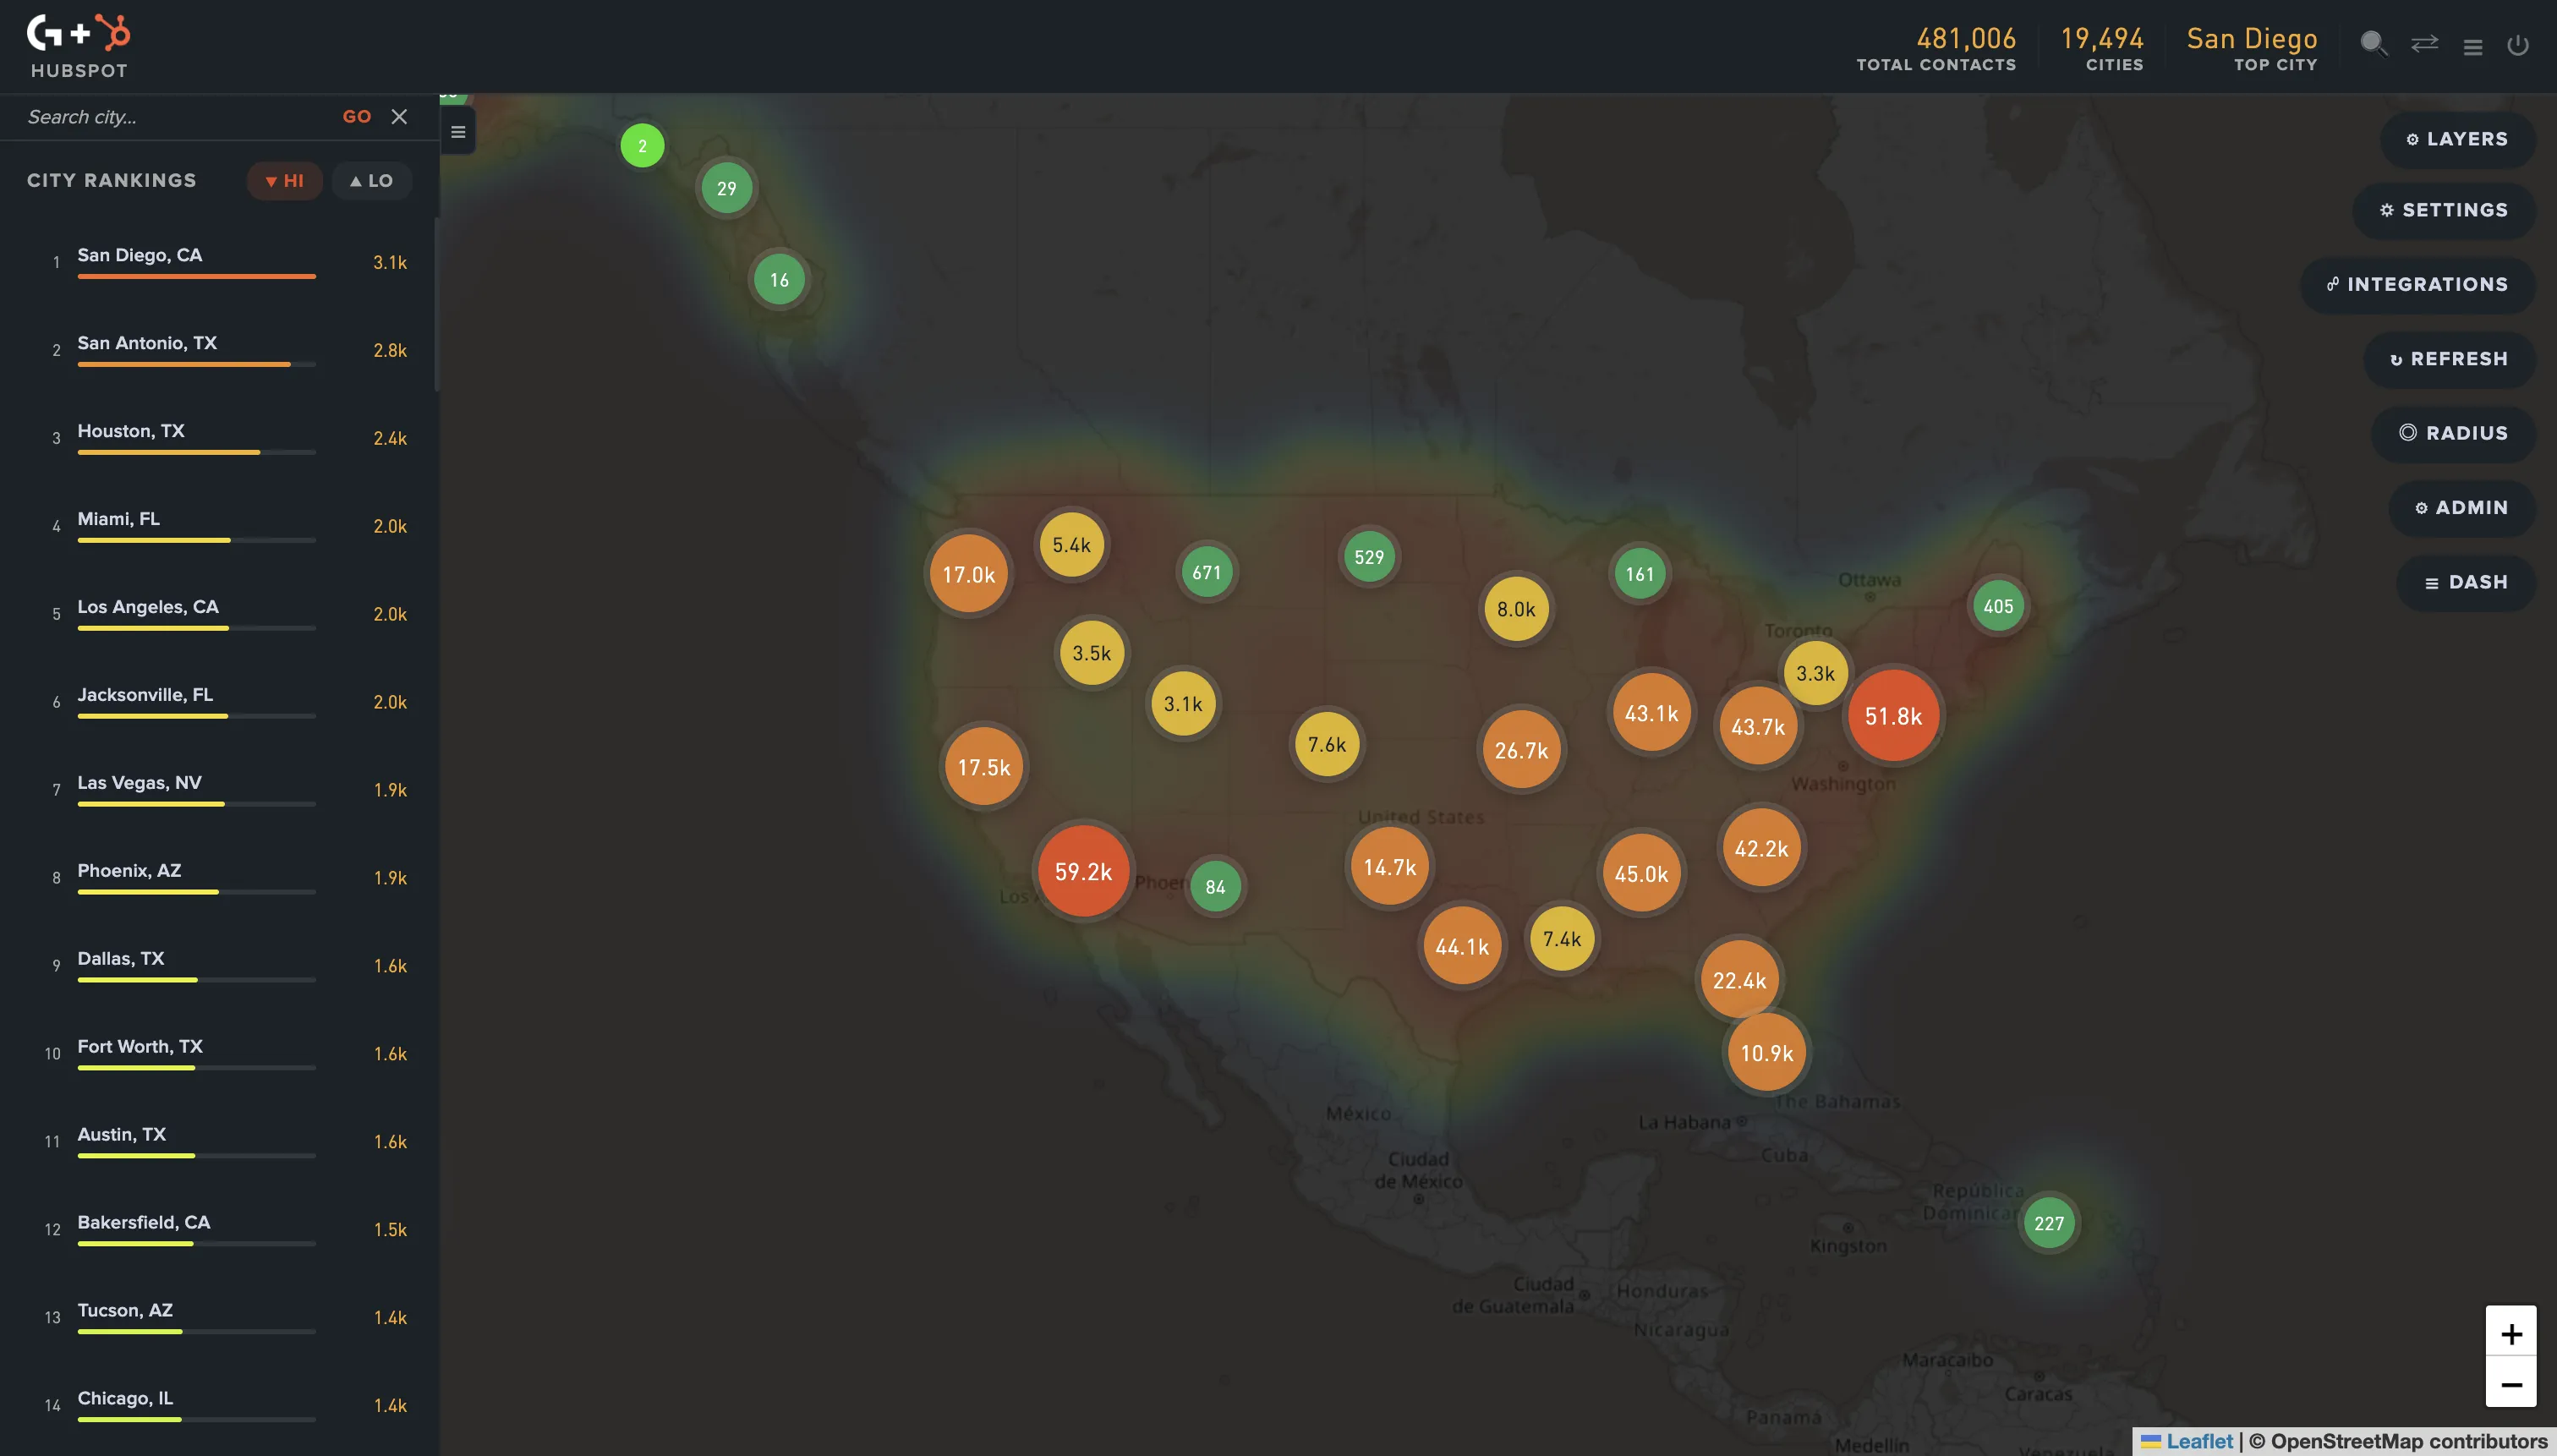
Pull your full customer + active opportunity list and render it as a heatmap. Don't filter at this stage; include everyone in the pipeline so you see total demand, not just closed-won.
What you're looking for: 5-15 distinct density clusters depending on company size. Most B2B sales teams cluster naturally around 5-10 metros.
2. Draw territory boundaries around natural clusters, not state lines
Each rep should own one or more density clusters that match their workload capacity. The territory boundary is whatever shape captures the cluster - usually a multi-state polygon or a radius around the cluster center, not a state outline.
Example: instead of "Texas territory," design a "Central Texas + Austin metro" territory and a separate "Texas Gulf Coast + Louisiana" territory. The two reps cover overlapping states but distinct customer concentrations.
3. Balance territories on the metric that matters most for your model
Choose one primary balancing metric:
- Total revenue (LTV-weighted) - best for established teams with stable customer bases
- Account count - simpler, works when LTV is uniform
- Total addressable market (TAM by metro) - best when expanding into new geographies
- Pipeline value - best for short-cycle, high-velocity sales
Adjust territory boundaries until the metric is roughly balanced across reps. Some imbalance is fine; major imbalance creates compensation friction within 60 days.
4. Assign reps based on territory characteristics, not seniority
A rep who's strong in mid-market tech buyers belongs in the Austin/Boulder/Raleigh territory. A rep who's strong in financial services belongs in the NYC + Boston territory. Match the territory's customer profile to the rep's experience instead of giving the senior rep "the best" territory by default.
State, ZIP, and map-based territory comparison
| Approach | Granularity | Balance quality | Rep ramp time |
|---|---|---|---|
| State-level | 50 buckets, all roughly equal in the model regardless of actual customer density | Poor - reps get unequal workloads from day one because state size doesn't match customer count | Slower - reps cover wide territories with thin context per metro |
| ZIP code | 41,000+ buckets, requires manual selection of dozens to hundreds of ZIPs per territory | Good if you put the work in, but the work is significant | Fast within metros but tedious to draw territories |
| Map-based polygons | Custom shapes that follow actual customer clusters and adjusted by metric balance | Strong - territories match real customer geography and can be balanced precisely on revenue or account count | Fastest - reps focus on natural clusters with deep context per metro |
| Map-based radius | Circles around metros or rep home base addresses | Strong for regional reps; less natural for multi-metro territories | Fast for straightforward zones, awkward for cross-state coverage |
What to layer onto the map
Geographic clustering alone gives you the structure. These four layers usually need to be on top:
- Account size segmentation. Mid-market and enterprise reps should rarely share a metro. Split clusters into AE + AM lanes within the same geography.
- Vertical specialization. A rep covering financial services in NYC may need a different rep covering healthcare in NYC, not "the NYC rep."
- Travel and meeting density. Field reps and inside reps need different territory shapes. Field reps need contiguous coverage zones with reasonable drive times; inside reps can take cross-country territories.
- Existing relationships. Reps with existing accounts in a region should usually keep them through the planning round. Reassigning known accounts costs more in trust than the optimization gains.
A real example: assigning a Southeast rep
A B2B SaaS team has 850 customers in the Southeast US. State-level reading of the CRM:
- Georgia: 280 customers
- North Carolina: 180 customers
- Florida: 240 customers
- Tennessee: 90 customers
- South Carolina: 35 customers
- Alabama: 25 customers
State-level conclusion: "Georgia is the biggest, hire a rep based in Atlanta."
Map-level reading (same data, plotted):
- Atlanta metro: 240 customers (concentrated in metro Atlanta)
- Charlotte metro: 130 customers (with Raleigh-Durham 70 customers nearby)
- Florida split: 100 in Miami metro, 90 in Tampa-Orlando, 50 spread across panhandle
- Nashville metro: 80 customers (Tennessee almost entirely here)
Map-level conclusion: design 3 territories instead of 1.
- Territory A: Atlanta metro + adjacent (300 customers)
- Territory B: Carolinas (Charlotte + Raleigh-Durham, 200 customers)
- Territory C: Florida (Miami + Tampa-Orlando, 240 customers)
Same 850 customers, three reps, balanced workloads, each rep specialized in their cluster. The state-level plan put one rep in charge of all 850 with no realistic coverage model.
How GeoList automates this
GeoList connects to HubSpot, Mailchimp, or Shopify, syncs your contacts and customers, and renders the heatmap automatically. The 4-step workflow above takes about 15 minutes once your CRM is connected, instead of the half-day spent in state-level pivot tables.
It supports:
- Contact and customer heatmap by metro
- City rankings (top metros by customer count for territory ordering)
- Radius circles around rep home addresses or office locations
- State and multi-state region selection for hybrid territory shapes
- Direct export of territory contacts back to your CRM as named lists for assignment
Common mistakes in map-based territory planning
- Drawing territory boundaries before plotting the data. This pre-bins the analysis into your assumptions. Plot first, draw boundaries second.
- Optimizing only on customer count. Two territories with 300 customers each can have very different revenue or workload if one is dominated by small accounts and the other by enterprise. Balance on revenue or LTV when you can.
- Reassigning every account every planning cycle. Continuity matters. Most teams should reassign no more than 15-20% of accounts per planning round.
- Treating geographic territory as the only dimension. For most B2B teams, geography is one input alongside vertical, account size, and product line. Pure geographic territories work for short-cycle, transactional sales; complex deals usually need a hybrid model.
- Ignoring travel time inside territories. A territory that looks compact on a map can have terrible drive times if it spans mountains, water, or traffic-heavy metros. Sanity-check with a few real drive estimates before finalizing.
Bottom line
State-level territories were a workable approximation in 1995 when CRMs didn't render geography and reps mostly did desk work. In 2026, with map-aware tooling and field reps expected to cover thousands of square miles, state lines as territory boundaries cost teams real productivity and quota fairness.
If your sales team has 4+ reps and you're using state-based territories, run the 4-step workflow on your CRM data this quarter. The redesign usually surfaces 1-2 territories that were obviously misallocated under the old model.
Frequently asked questions
Annually for most B2B teams, with smaller mid-year adjustments when significant new customer concentrations emerge. Avoid redesigning more often than every 6 months because the disruption cost (rep ramp, account transitions, comp recalibration) usually exceeds the optimization benefit. The exception is fast-growing teams adding 5+ reps per quarter, where every new hire forces a small redesign.
Field rep territories should usually be contiguous because of travel time. Inside rep territories can be split (a rep can cover Atlanta + Boston without driving between them), which gives you more flexibility to match rep skill to customer profile. A contiguous-only constraint sometimes forces suboptimal rep assignment when the natural clusters are far apart.
Layer drive-time analysis onto the customer heatmap before finalizing boundaries. Tools like the Google Maps Distance Matrix API and route-planning platforms calculate realistic drive times between cluster points. A territory that spans 200 highway miles is workable; one that spans 200 miles with a mountain range or harbor in the middle isn't.
Yes - this is actually the most common production setup. Use the map to define the geographic outer shape, then split the territory by vertical or account size within the geo. So a single Atlanta metro becomes "Atlanta - Mid-market Tech" + "Atlanta - Enterprise Healthcare" + "Atlanta - All Other." The map gives you the territory shape; the secondary axis gives you the rep specialization.
Roughly 3+ reps. With 1-2 reps, geographic territory matters less because each rep covers everything anyway. The map analysis still helps for ICP analysis and expansion targeting (covered in our post on finding expansion opportunities in CRM data) but the territory-design value compounds with team size.